Program 8
Write a Python program to explain working with bokeh line graph using Annotations and Legends. a) Write a Python program for plotting different types of plots using Bokeh.
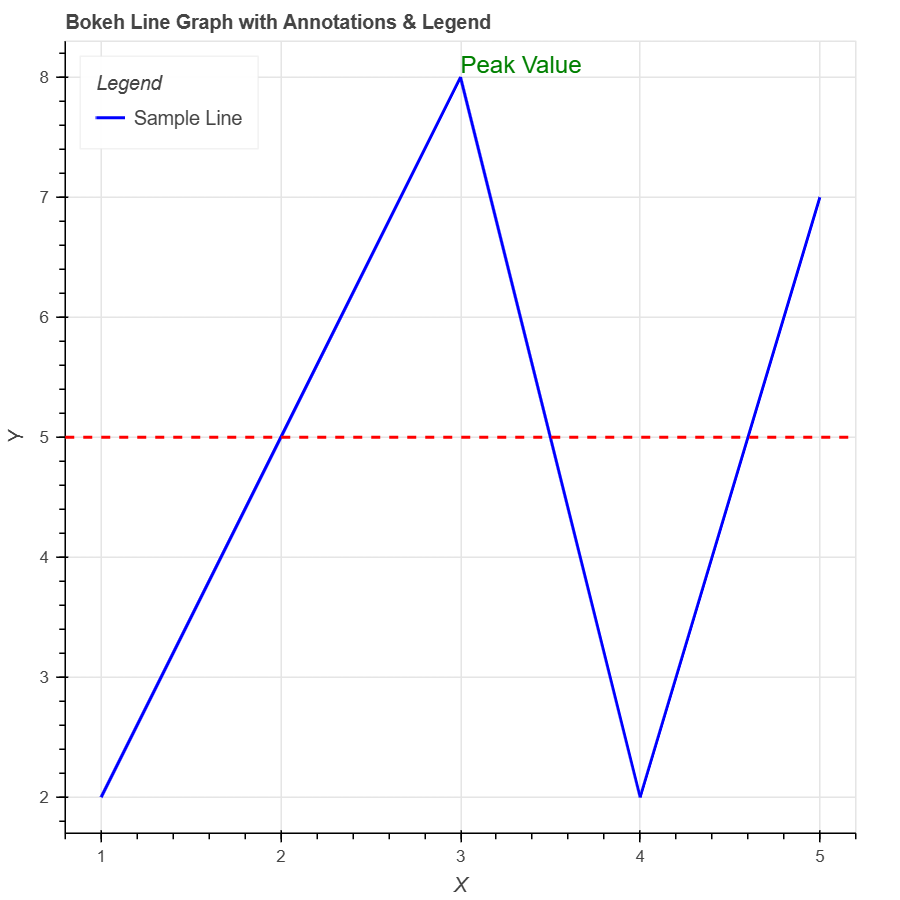
from bokeh.plotting import figure, show
from bokeh.models import Span, Label

# Data
x = [1, 2, 3, 4, 5]
y = [2, 5, 8, 2, 7]

# Create a figure
p = figure(title="Bokeh Line Graph with Annotations & Legend", x_axis_label="X", y_axis_label="Y")

# Line with legend
p.line(x, y, line_width=2, color="blue", legend_label="Sample Line")

# Add annotation: horizontal line
hline = Span(location=5, dimension='width', line_color='red', line_width=2, line_dash='dashed')
p.add_layout(hline)

# Add text label
label = Label(x=3, y=8, text="Peak Value", text_color="green")
p.add_layout(label)

# Show legend
p.legend.title = "Legend"
p.legend.location = "top_left"

show(p)
Output :-
Replay !
Share Your Thoughts