Program 9
Write a Python program to draw 3D Plots using Plotly Libraries.
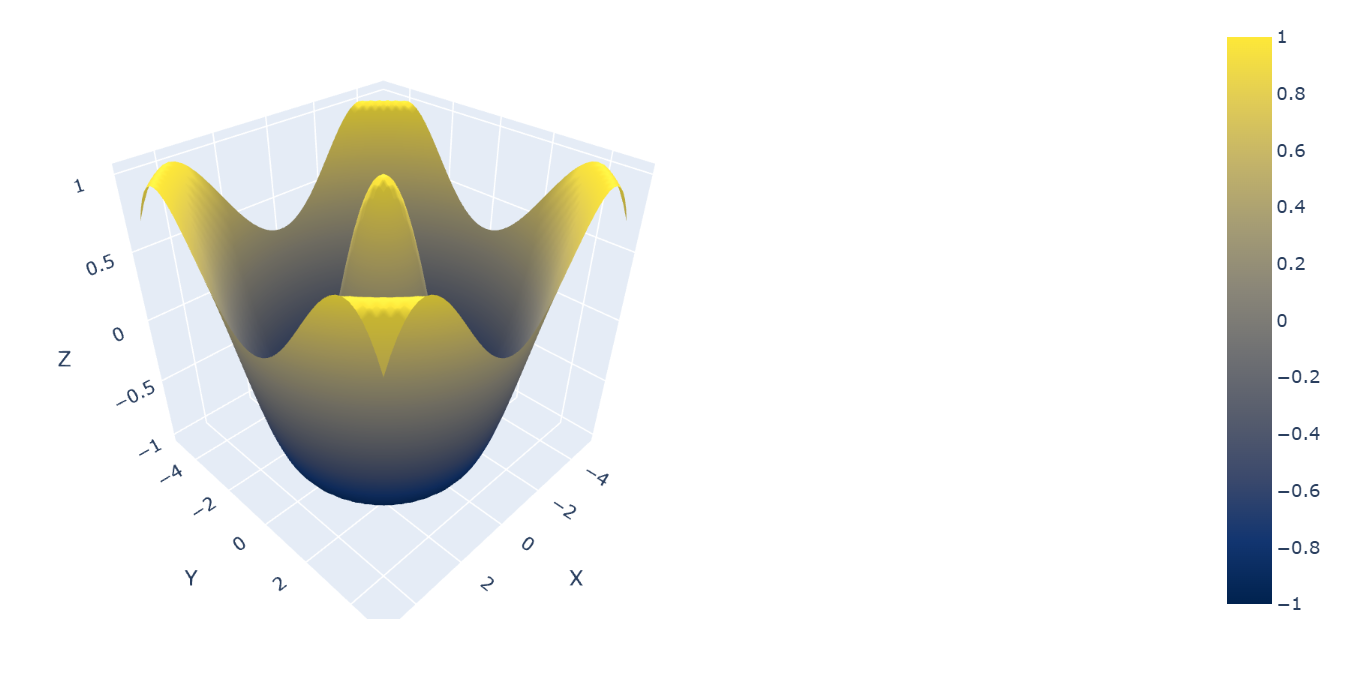
import numpy as np
import plotly.graph_objects as go

# Create grid data
X = np.linspace(-5, 5, 50)
Y = np.linspace(-5, 5, 50)
X, Y = np.meshgrid(X, Y)
Z = np.cos(np.sqrt(X**2 + Y**2))

# Create 3D Surface Plot
fig = go.Figure(data=[go.Surface(z=Z, x=X, y=Y, colorscale="Cividis")])
fig.update_layout(title="3D Surface Plot", scene=dict(xaxis_title="X", yaxis_title="Y", zaxis_title="Z"))

fig.show()
Output :-
Replay !
Share Your Thoughts