Program
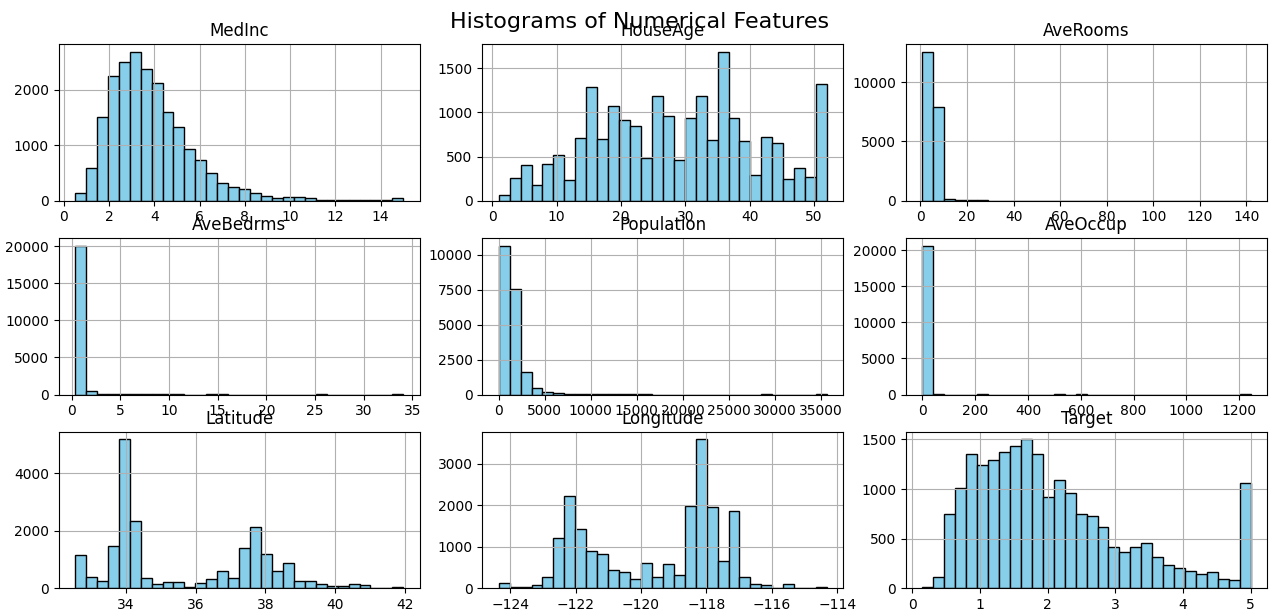
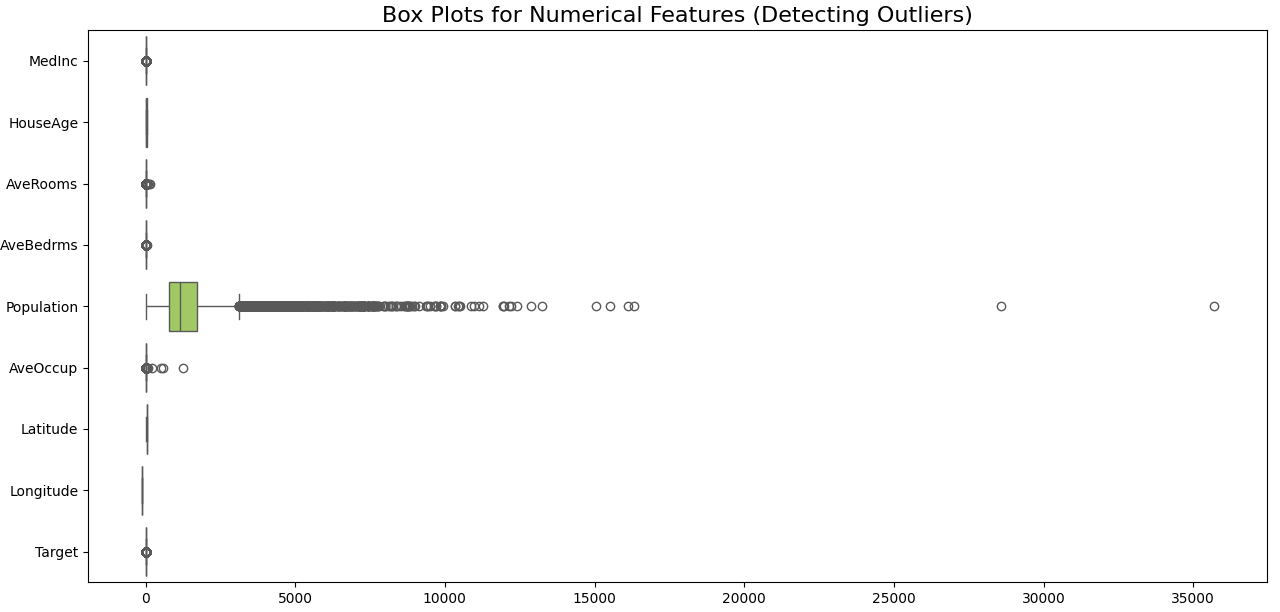
1. Develop a program to create histograms for all numerical features and analyze the distribution of each feature. Generate box plots for all numerical features and identify any outliers. Use California Housing dataset.
import pandas as pd
import numpy as np
import matplotlib.pyplot as plt
import seaborn as sns
from sklearn.datasets import fetch_california_housing

california_housing = fetch_california_housing()
X = california_housing.data
y = california_housing.target

df = pd.DataFrame(X, columns=california_housing.feature_names)
df["Target"] = y

print("\n📊 Statistical Summary of the Dataset:")
print(df.describe())

df.hist(bins=30, figsize=(15, 10), color='skyblue', edgecolor='black')
plt.suptitle('Histograms of Numerical Features', fontsize=16)
plt.tight_layout()
plt.show()

plt.figure(figsize=(15, 8))
sns.boxplot(data=df, orient="h", palette="Set2")
plt.title('Box Plots for Numerical Features (Detecting Outliers)', fontsize=16)
plt.tight_layout()
plt.show()

def find_outliers_iqr(data):
    outlier_dict = {}
    for column in data.columns:
        Q1 = data[column].quantile(0.25)
        Q3 = data[column].quantile(0.75)
        IQR = Q3 - Q1
        lower_bound = Q1 - 1.5 * IQR
        upper_bound = Q3 + 1.5 * IQR

        outliers = data[(data[column] < lower_bound) | (data[column] > upper_bound)][column]
        if not outliers.empty:
            outlier_dict[column] = outliers.values
    return outlier_dict

outliers = find_outliers_iqr(df)
Output:
📊Statistical Summary of the Dataset:

             MedInc      HouseAge  ...     Longitude        Target
count  20640.000000  20640.000000  ...  20640.000000  20640.000000
mean       3.870671     28.639486  ...   -119.569704      2.068558
std        1.899822     12.585558  ...      2.003532      1.153956
min        0.499900      1.000000  ...   -124.350000      0.149990
25%        2.563400     18.000000  ...   -121.800000      1.196000
50%        3.534800     29.000000  ...   -118.490000      1.797000
75%        4.743250     37.000000  ...   -118.010000      2.647250
max       15.000100     52.000000  ...   -114.310000      5.000010

[8 rows x 9 columns]