Program
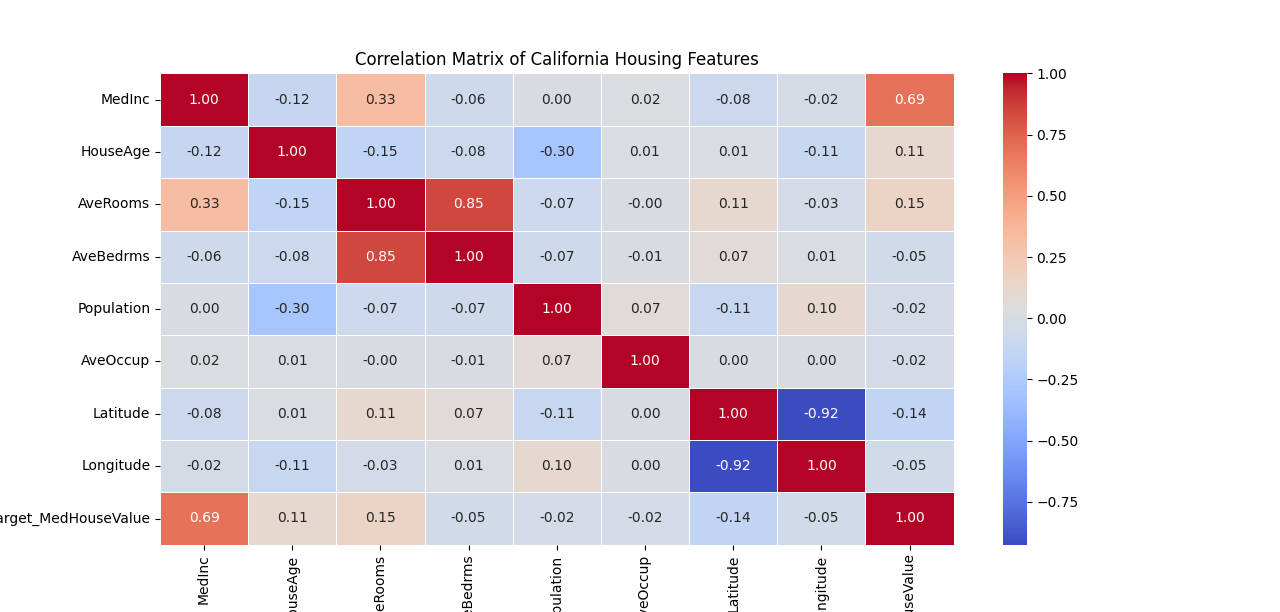
2. Develop a program to Compute the correlation matrix to understand the relationships between pairs of features. Visualize the correlation matrix using a heatmap to know which variables have strong positive/negative correlations. Create a pair plot to visualize pairwise relationships between features. Use California Housing dataset.
import numpy as np
import pandas as pd
import seaborn as sns
import matplotlib.pyplot as plt
from sklearn.datasets import fetch_california_housing


california = fetch_california_housing()
df = pd.DataFrame(california.data, columns=california.feature_names)

df["Target_MedHouseValue"] = california.target

correlation_matrix = df.corr()

plt.figure(figsize=(10, 8))
sns.heatmap(correlation_matrix, annot=True, cmap="coolwarm", fmt=".2f", linewidths=0.5)
plt.title("Correlation Matrix of California Housing Features")
 lt.show()

sns.pairplot(df.sample(500), diag_kind="kde")  # Sample 500 rows for better visualization
plt.show()
Output: