Program
5. Develop a program to implement k-Nearest Neighbour algorithm to classify the randomly generated 100
values of x in the range of [0,1]. Perform the following based on dataset generated.
a. Label the first 50 points {x1,……,x50} as follows: if (xi ≤ 0.5), then xi ∊ Class1, else xi ∊ Class1
b. Classify the remaining points, x51,……,x100 using KNN. Perform this for k=1,2,3,4,5,20,30
import numpy as np
import matplotlib.pyplot as plt
from sklearn.neighbors import KNeighborsClassifier
np.random.seed(42)
x_values = np.random.rand(100).reshape(-1, 1)
y_labels = np.array([1 if x <= 0.5 else 2 for x in x_values[:50]]) # Class 1 for x ≤ 0.5, else Class 2
X_train = x_values[:50]
y_train = y_labels
X_test = x_values[50:]
k_values = [1, 2, 3, 4, 5, 20, 30]
predictions = {}
for k in k_values:
knn = KNeighborsClassifier(n_neighbors=k)
knn.fit(X_train, y_train)
y_pred = knn.predict(X_test)
predictions[k] = y_pred
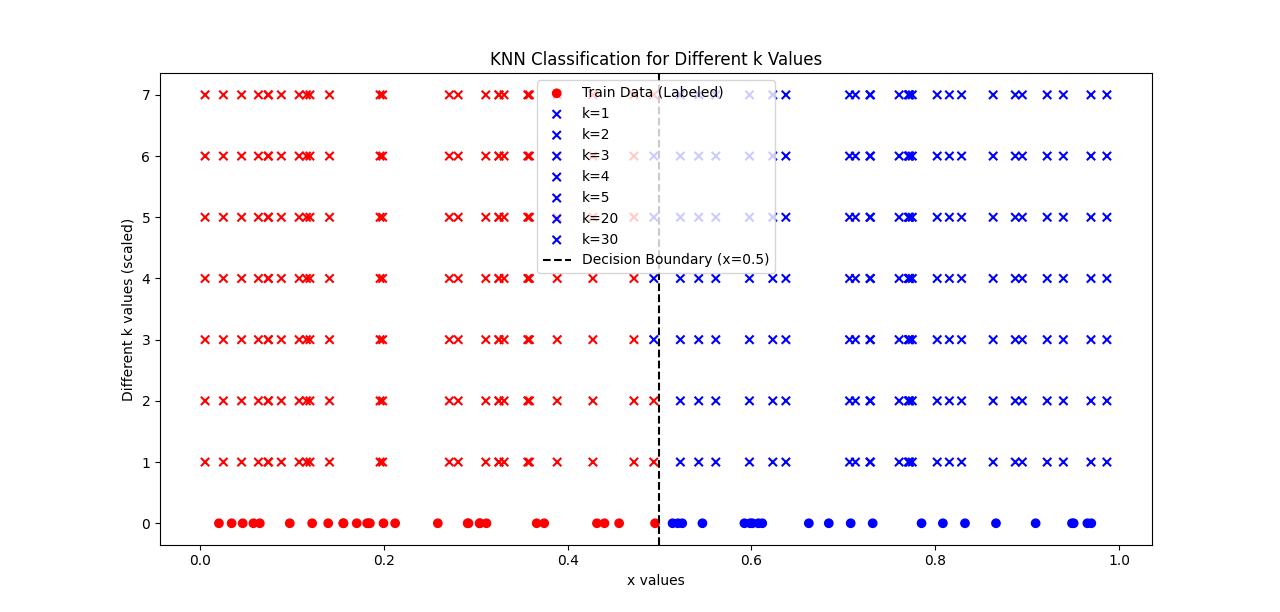
plt.figure(figsize=(10, 6))
plt.scatter(X_train, np.zeros_like(X_train), c=['red' if y == 1 else 'blue' for y in y_train], label="Train Data (Labeled)", marker='o')
for i, k in enumerate(k_values):
plt.scatter(X_test, [i+1]*len(X_test), c=['red' if y == 1 else 'blue' for y in predictions[k]], marker='x', label=f"k={k}")
plt.axvline(x=0.5, color="black", linestyle="--", label="Decision Boundary (x=0.5)")
plt.xlabel("x values")
plt.ylabel("Different k values (scaled)")
plt.title("KNN Classification for Different k Values")
plt.legend()
plt.show()
Output: