Program
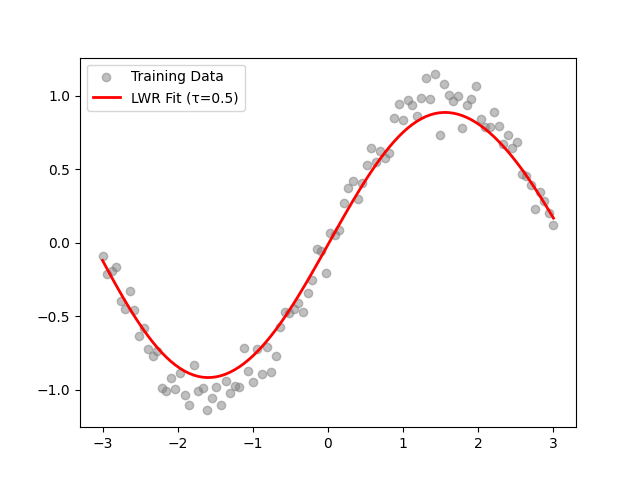
6. Implement the non-parametric Locally Weighted Regression algorithm in order to fit data points. Select appropriate data set for your experiment and draw graphs
import numpy as np
import matplotlib.pyplot as plt

np.random.seed(42)
X = np.linspace(-3, 3, 100).reshape(-1, 1)
y = np.sin(X).ravel() + np.random.normal(scale=0.1, size=X.shape[0])

def locally_weighted_regression(x_query, X_train, y_train, tau):
    W = np.exp(-((X_train - x_query) ** 2) / (2 * tau ** 2))
    X_bias = np.c_[np.ones_like(X_train), X_train]
    theta = np.linalg.pinv(X_bias.T @ np.diag(W.ravel()) @ X_bias) @ X_bias.T @ np.diag(W.ravel()) @ y_train
    return np.array([1, x_query]) @ theta  # Predict y for x_query

X_test = np.linspace(-3, 3, 100)
y_pred = np.array([locally_weighted_regression(x, X, y, tau=0.5) for x in X_test])

plt.scatter(X, y, color="gray", alpha=0.5, label="Training Data")
plt.plot(X_test, y_pred, color="red", linewidth=2, label="LWR Fit (τ=0.5)")
plt.legend()
plt.show()
Output: